Many of you are required to start making year-end reports based on data that resides within Asana and Trello. Bridge24 should be part of your solution to create useful data products such as structured reports, and visual charts. Especially now, given that both support the use of custom fields!
Use Custom Fields to Create Dynamic Charts
Custom fields are a widely used feature within Asana and Trello since they allow you to add fields for your specific workflow. There are so many ways to use them, such as: adding a field to categorize your product, a status field for a special sign-off procedure, a version field for a release, a yes/no for any required action, etc. After all this data has been entered, how can you easily draw useful information to create summaries, or to see trends?
Bridge24 released the ability to use custom fields for grouping in Reports several months ago. Since last week, custom fields can now be used to generate dynamic charts using your custom field data from Asana and Trello at the click of a button.
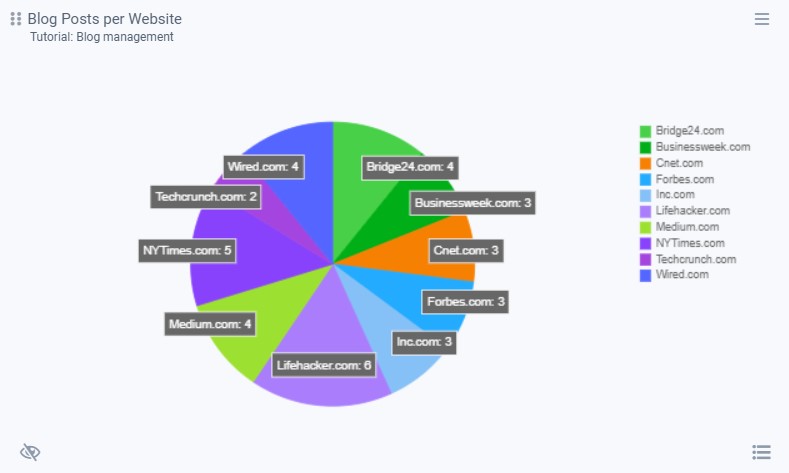
Below is an example of a chart based on an Asana account using a text custom field called “Website” with tasks associated with a website name. Group tasks across all projects based on the custom field values. Since it is dynamic, you can click on any segment to bring up the task list, show/hide websites by clicking the item in the legend and even export the chart to a PDF.
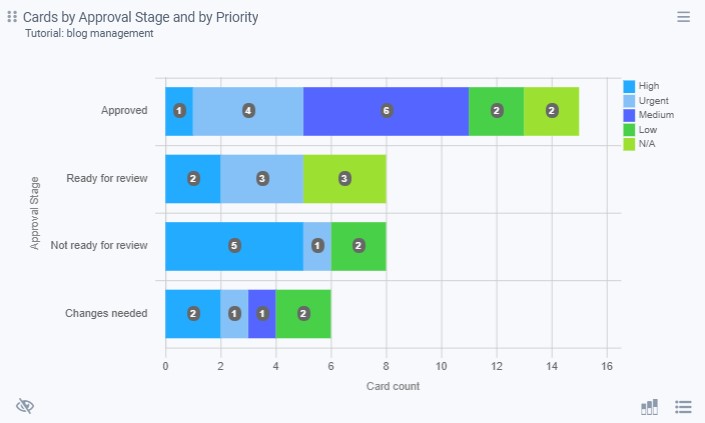
An additional great feature is to use Chart stacking, or in other words, present 2 variables in the same chart. In the case below, using custom fields in Trello, a horizontally stacked chart displaying the number of cards by “Approval stage” is stacked by “Priority”.
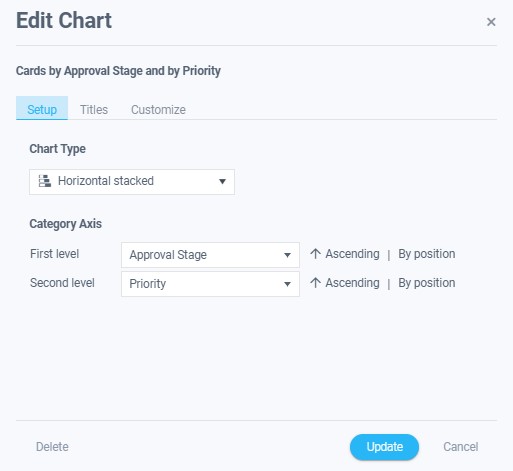
You can always modify the chart by selecting a different chart type, variables or other settings:
Whether a chart by User, Project, Board, custom field value, or other, be sure to use Bridge24 for your reporting needs for Asana and Trello!
Leave A Comment