INTERACTIVE CHARTS AND GRAPHS
ASANA
Options Overview
Charting And Graphing Options For Asana
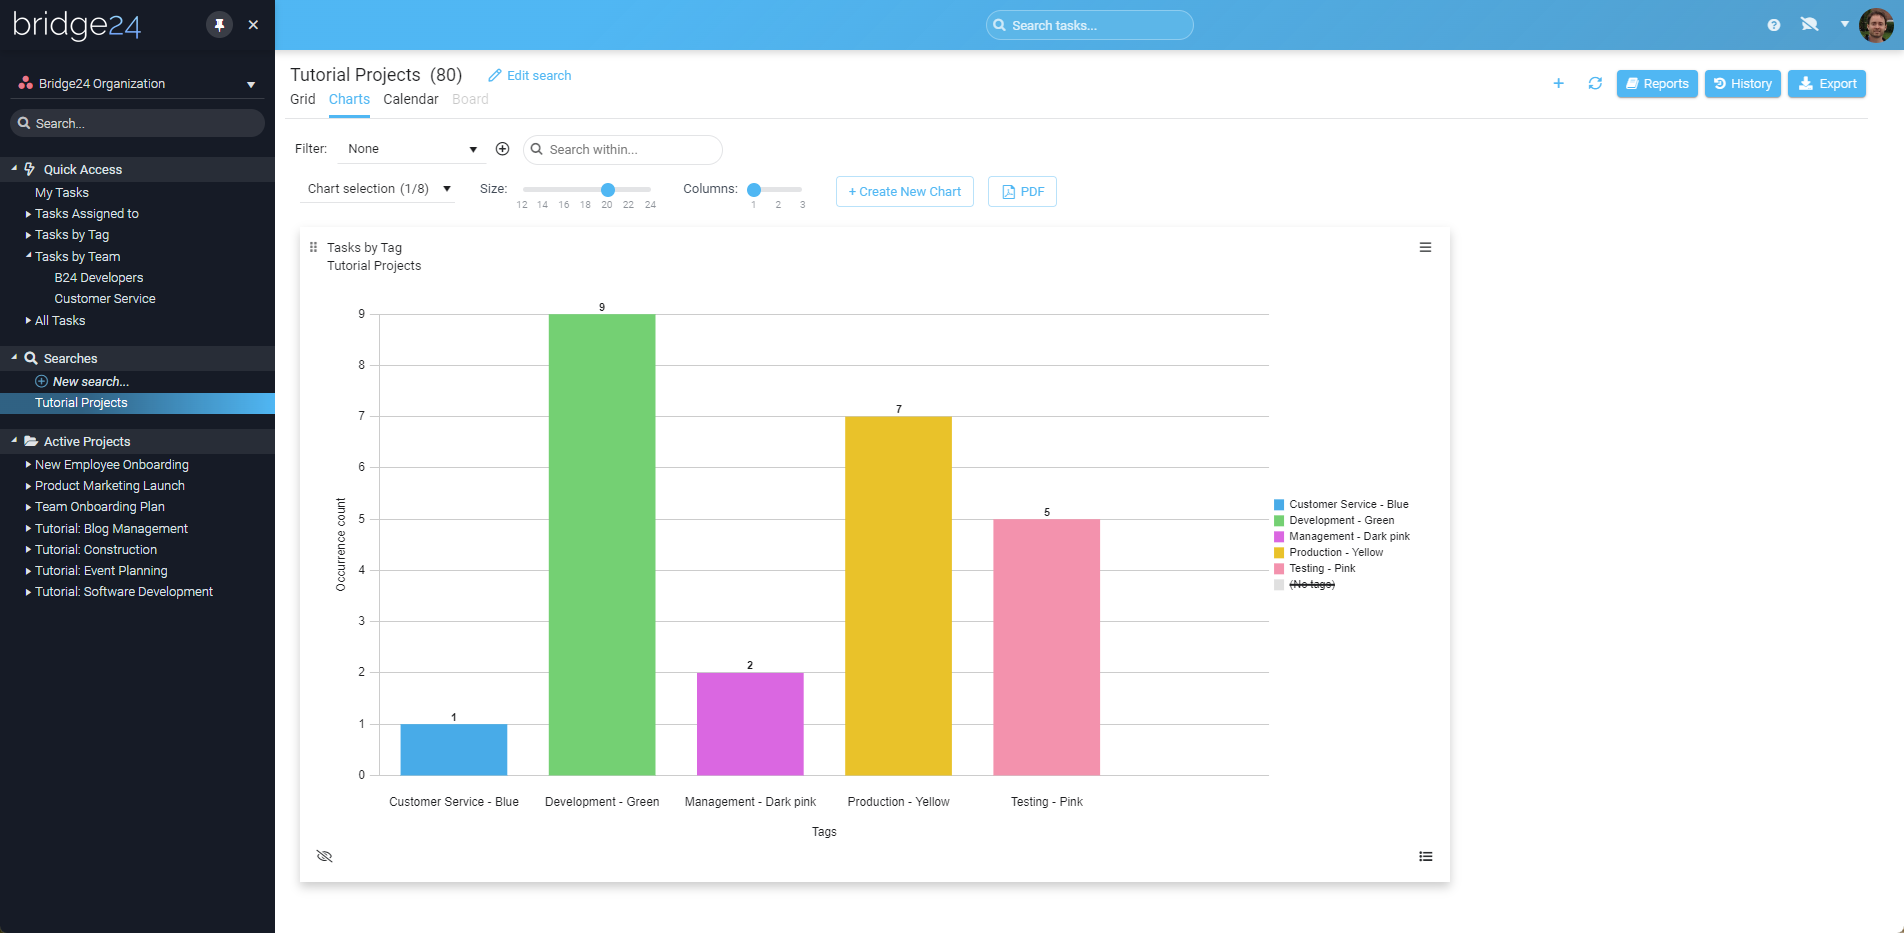
Video Explanation
Asana Interactive Charts & Graphs Tutorial
The following video describes how Bridge24 can be used to derive interactive charts and graphs using Asana tasks pulled dynamically using our app.
For more information, you can visit our blog.
Video Explanation
Asana Interactive Charts & Graphs Tutorial
The following video describes how Bridge24 can be used to derive interactive charts and graphs using Asana tasks pulled dynamically using our app.
For more information, you can visit our blog.
Our Happy Clients
Real Bridge24 reviews. Real results. Will you be our next success story?


Our Happy Clients
Real Bridge24 reviews. Real results. Will you be our next success story?