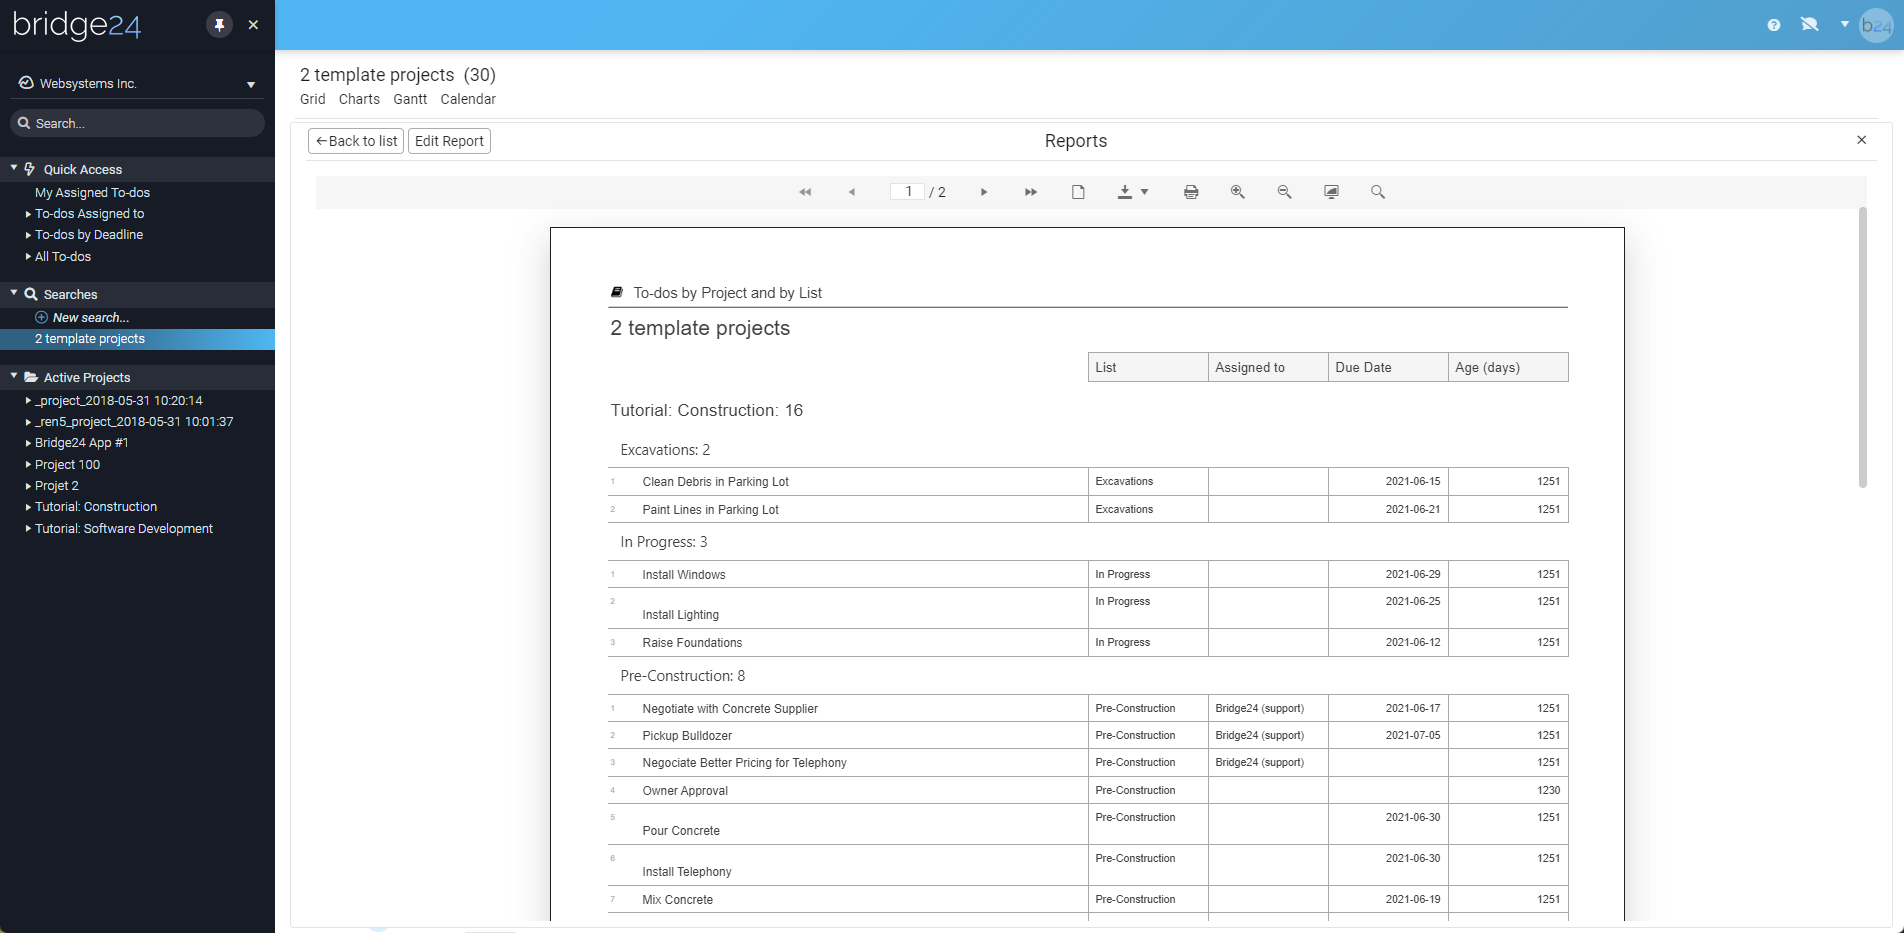
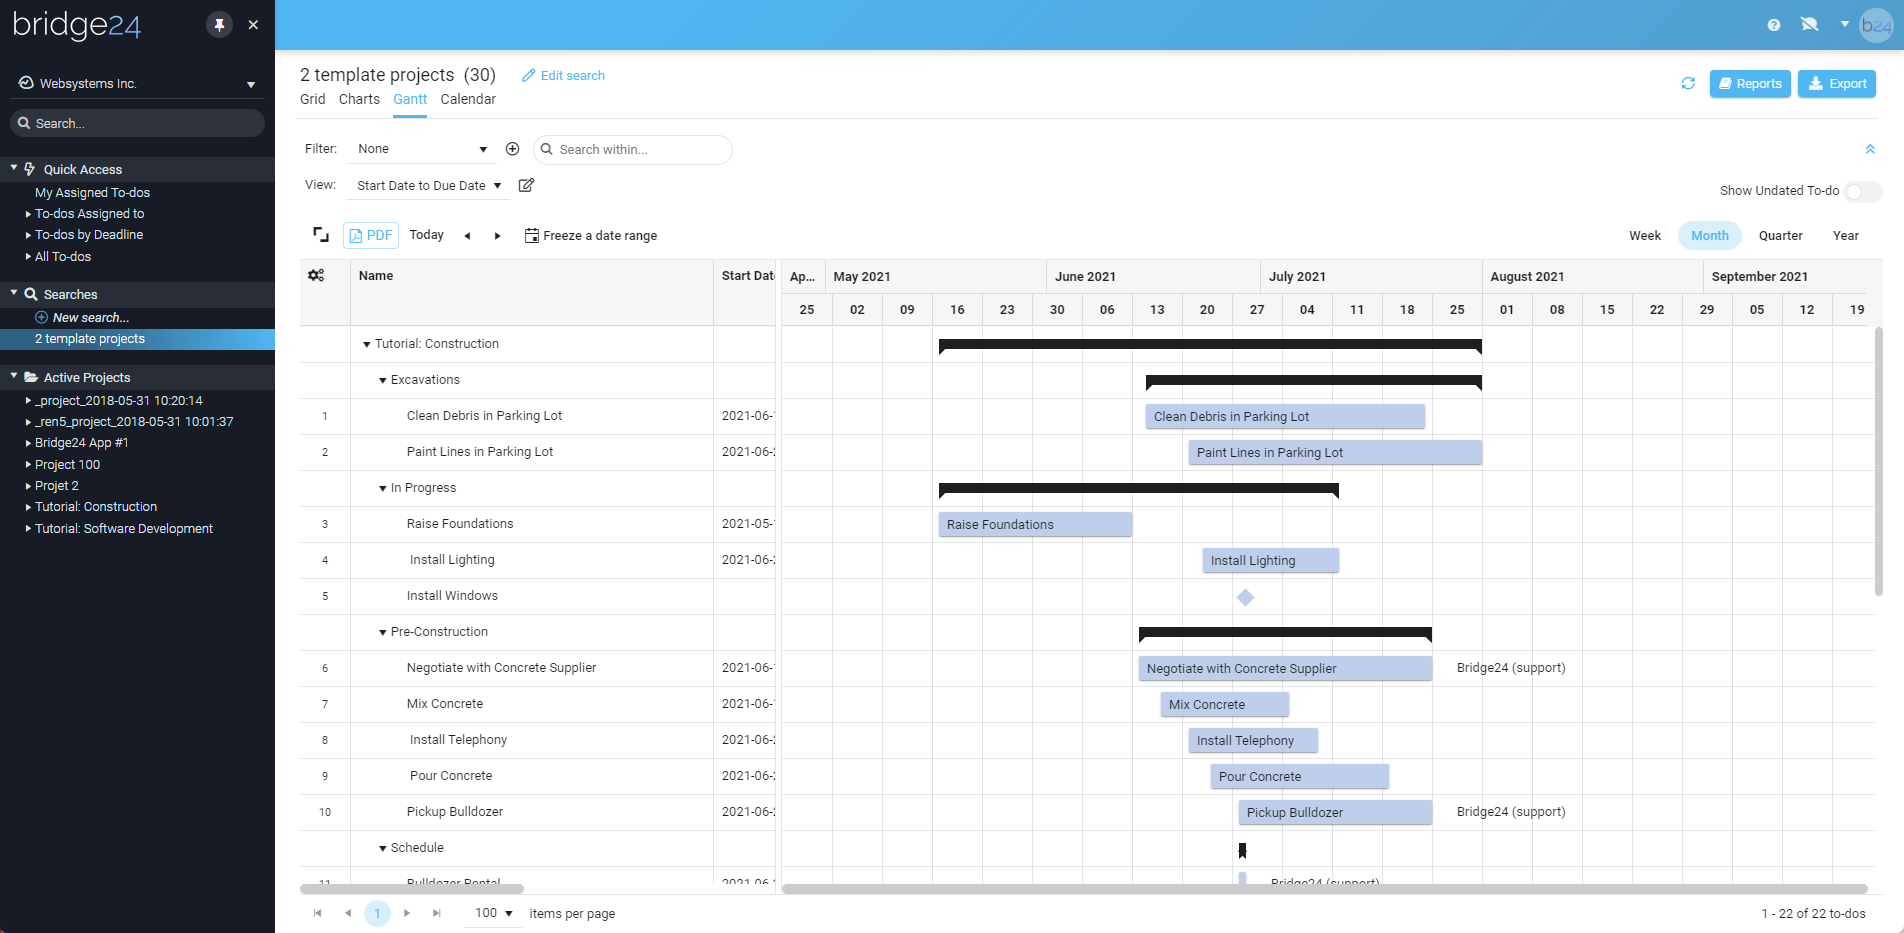
Filling The Reporting & Exporting Gap For

BASECAMP

Basecamp’s

Features & Benefits

There is no doubt that Basecamp is a great app, considered an industry leader, and serving millions of happy users. To keep the application simple and easy to use, some compromises are required. These compromises include providing basic features for more high-end or complex needs. Bridge24 is here to expand on those existing and sometimes non-existing features.

Interactive Charts

  • Automated creation of popular charts including to-dos by: project, assignee, status, overdue, and more…

  • The different chart types supported are: pie chart, doughnut, polar, horizontal bar, and vertical bar

  • Chart stacking, allowing to display 2 variables in the same chart

  • Drill down by clicking on a segment in the chart to see the corresponding to-dos

  • Export chart and associated to-dos list to PDF

Advanced Reports

  • Advanced reports with 2 level grouping with unlimited columns

  • Sort to-dos by any field and set the report orientation in landscape or portrait format

  • Wide fields such as notes and comments can be displayed

  • The report is available in multiple export formats including PDF and Excel

  • Create and save several reports, and use them for future use

  • Include totals and subtotals on fields on each group levels. average, count, maximum, minimum, and sum available

Export To-dos

  • Export Basecamp cards, to-dos and projects to Excel & CSV & PDF formats

  • The export can include comments and attachments on separate sheets

  • Choose the columns to export, or export all columns

  • You can export your to-dos based on specific criteria like projects, lists, deadlines, assignees, etc.

  • Use this export feature as a backup for all your to-dos, included completed one

  • Generate any report using the report engine, and export it to Excel or PDF

Grid View

  • Display Search results within a flexible standard grid

  • Resize column widths, show/hide and dynamically arrange field order

  • Sort displayed information by clicking on the field header name

  • Group displayed to-dos by drag-drop of the column name into the group area

  • Display included calculated fields (age & time to completion)

  • Dynamically filter to-dos using all field information

  • Export grid content to Excel/CSV

Calendar View

  • Display tasks in a dynamic calendar view

  • Change time scale (day, week, month, agenda)

  • Drag and drop start and end dates to modify to-do dates dynamically

  • Use any date to display on the calendar. Not restricted to start and end dates only.

  • For example, use the created date and completed date for a range, or the last update date for a single date

  • Dynamically filter the calendar using the “Search within…” or create a filter with several criteria

  • Export the Calendar to PDF

Gantt Chart View

  • View to-dos in a Gantt chart or timeline view

  • Change time scale (day, week, month, quarter, year)

  • View to-dos grouped by milestone (list)

  • Use any date to display on the Gantt. Not restricted to start and end dates only. For example, use the created date and completed date

  • Modify display characteristics such as grouping, sorting options and text to display on bars

  • Export the Gantt to PDF

Our Happy Clients

Real Bridge24 reviews. Real results. Will you be our next success story?

Our Happy Clients

Real Bridge24 reviews. Real results. Will you be our next success story?

Not ready to sign up?

If you have any questions about our services, or wish to speak with someone from our client support
team before signing up, we’d love to hear from you!