 Bridge24 is an innovative application that enables users to manage their projects, tasks, and reports much more easily. It enhances the reporting and exporting capabilities of online project management tools such as Trello, Asana, Basecamp, and AceProject. Recently, it launched another free Chrome extension, the Trello Chart Suite Chrome Extension. When added to Chrome, Trello users will be able to create charts in one click. This nifty reporting tool helps them understand better and quickly the distribution of cards. Similarly, they now have instant access to useful information in a visual form.
Features and Benefits
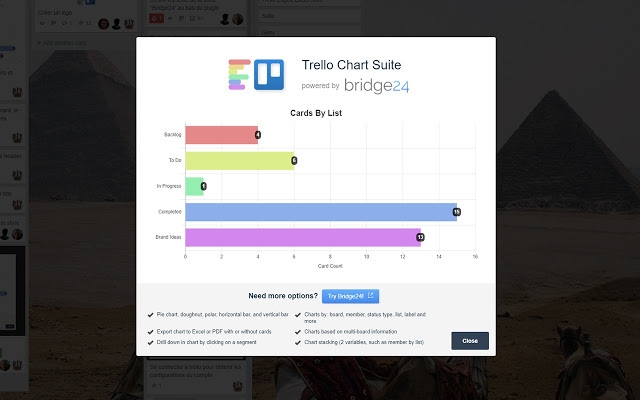
Trello Chart Suite uses the same reporting engine that runs under the hood of Bridge24. It is the same program that creates interactive charts from Trello data, as well as other project management tools that it connects dynamically with. Users on Chrome browser can generate a horizontal bar chart from their current Trello board, with counts per list, in one easy click of a button. Thus, they are able to see, not only the exact number of cards per list, but also how much tasks have been completed, in progress, and needs to be completed in a side-by-side visual representation.
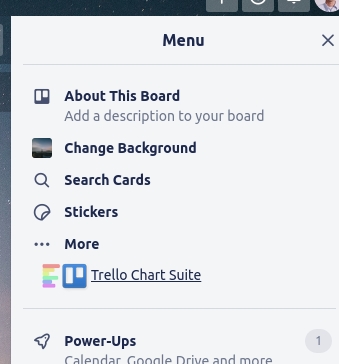
Easy Install and Access
Installing the free Chrome extension is simple. Just click the Add to Chrome button and the less than 1MB software will be added in a few seconds. Users may have to refresh their browser to see the extension displayed in Trello. They can access the software in Trello from Menu, then Trello Chart Suite. If the Menu side panel is hidden, clicking the “… Show Menu” button will display it, and from there, the Trello Chart Suite icon/link will be visible.
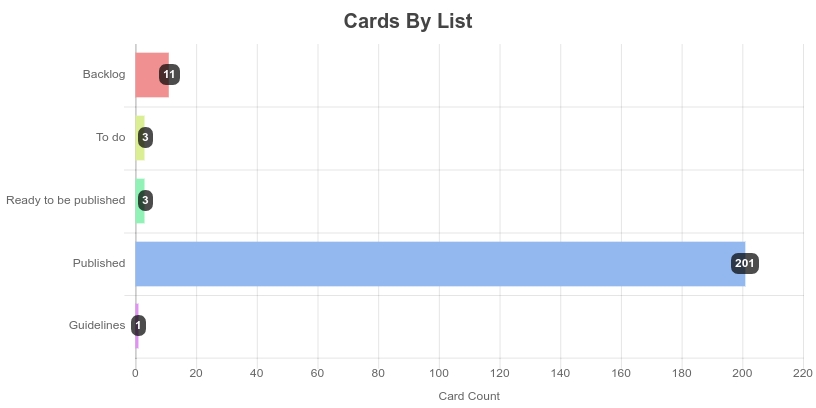
Easy Chart Generation
Trello Chart Suite works accurately fast on any board. After clicking it from the menu, users can instantly see the horizontal bar chart. The graduations of the bars provide a good representation of the number of cards on each list relative to all the lists. Moreover, the chart displays the exact count at the tip of each bar for detailed information. They can save the chart image and view it at a later time. They can also copy and paste it on documents for reporting purposes.
For All Type of Users
Charts provide information-at-a-glance and helpful insight that shows not only the bigger picture, but also ratio and relationships of the individual items among each other. It is beneficial to all types of users, from senior management that needs only an overview, to individual users working on each tasks, as well as teams measuring their group performance. Whether using the Chrome extension or the full Bridge24 application, users share only positive feedback. Richard describes it as the best reporting application and the only one supporting custom fields. Tyler was about to leave Trello but decided to stay when he started using Bridge24.
Trello Chart Suite – Instant Visual Reporting
Users today have the option to work on a number of interfaces. They can work on their primary project management tool like Trello. They can also work on Bridge24 for Trello, the full-featured application that dynamically connects to the PM tool, syncs both ways in real time, and provides additional powerful views, advanced filters and reports, and also easy and accurate exporting capabilities. In addition, users can simply use their browsers like Chrome with the Trello Chart Suite add-on, and generate quick charts that shows the card counts per list of their board. Nowadays, users can decide to do things their way.
To learn more about the enhanced reporting and exporting capabilities of Bridge24 and other updates, visit also its Facebook, Twitter, or YouTube page.
Leave A Comment