New Charting Options in Bridge24 for Asana, Trello, Basecamp and AceProject
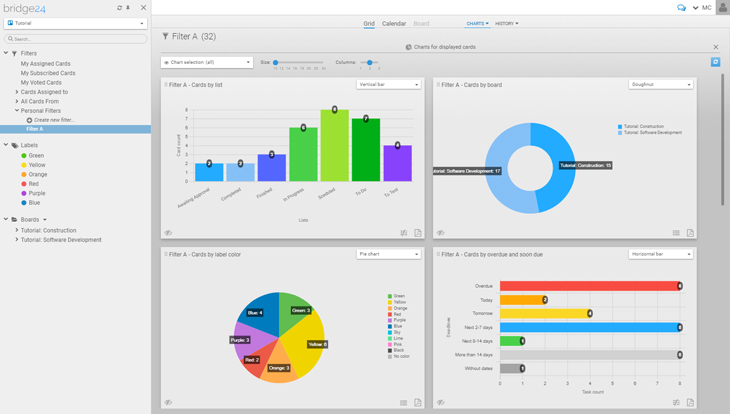
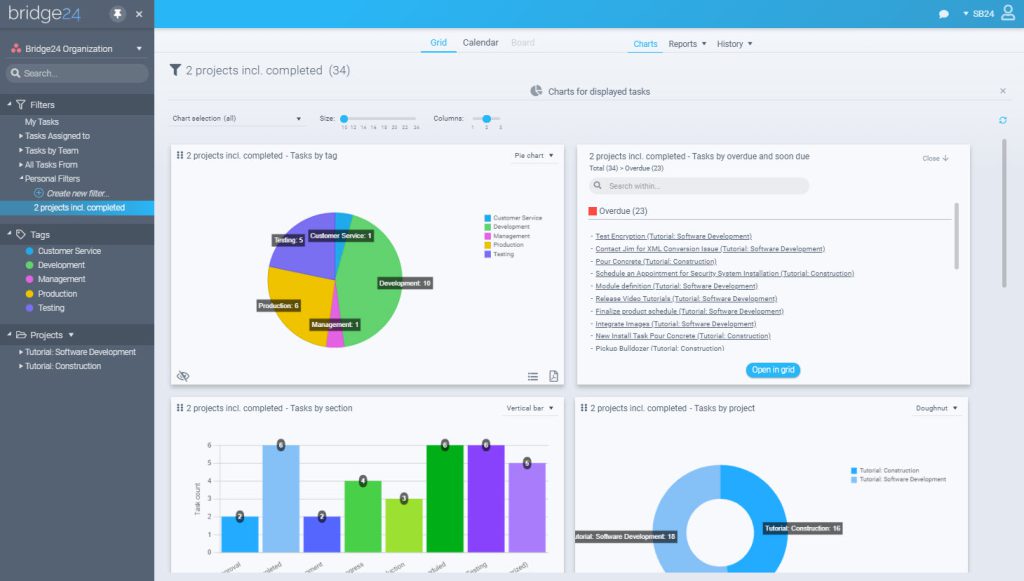
A number of new enhancements for charts has just been released in time for the Holidays! Charts add a flexible representation of your data that provides visual grouping for instant interpretation. Connect, filter, then display charts in Bridge24 for Asana, Basecamp, Trello, or AceProject. Access to your data has never been easier!
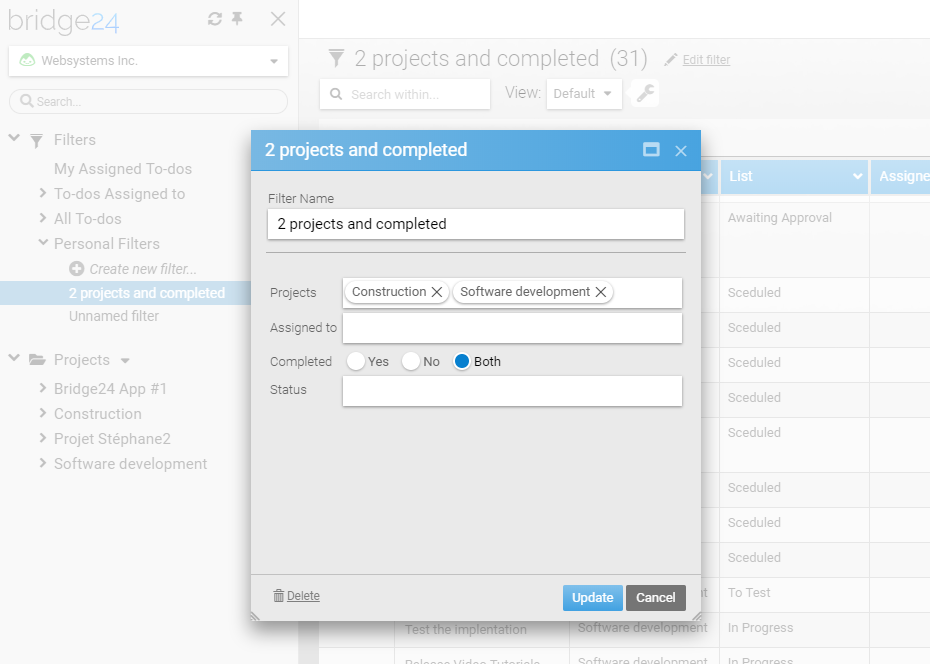
Access options from the menu on the top right of any vertical or horizontal bar chart:
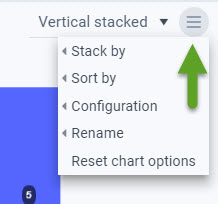
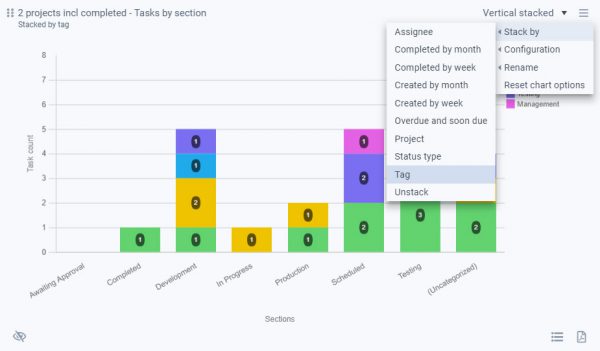
Chart Stacking
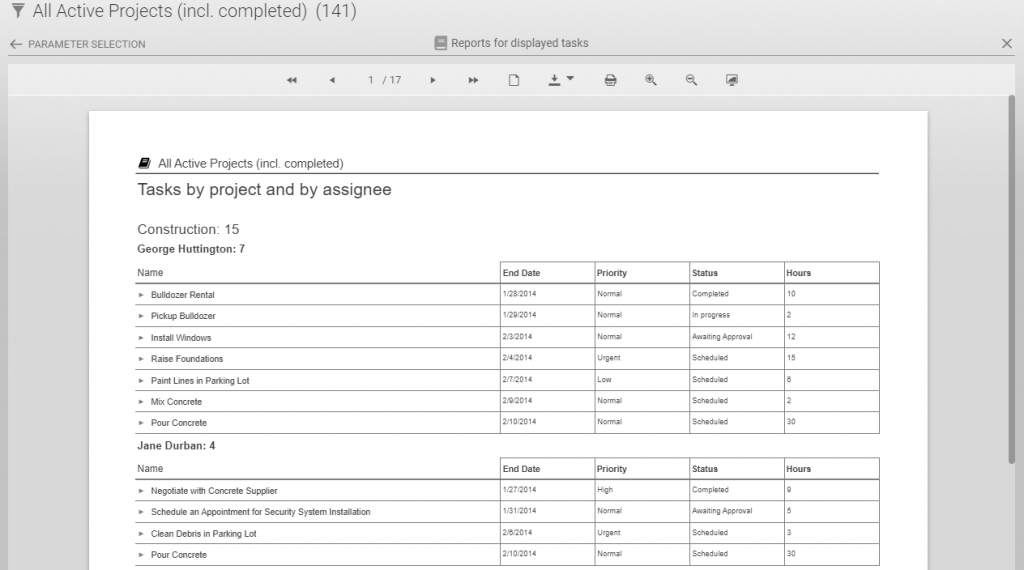
One exciting feature is the ability to “stack” or display 2 variables in the same chart. For example, You are able to display all tasks by Project and then stack by Tag or Assignee. Click on a chart column to drill down to view by category and subcategory and open in the Grid for further analysis or export.
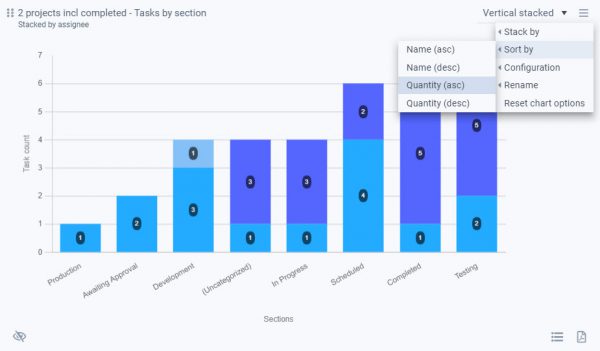
Sorting
The order displayed in the legend and chart can now be modified. You can sort alphabetically, when stacking by Assignees for example, or by Quantity of each stacked value.

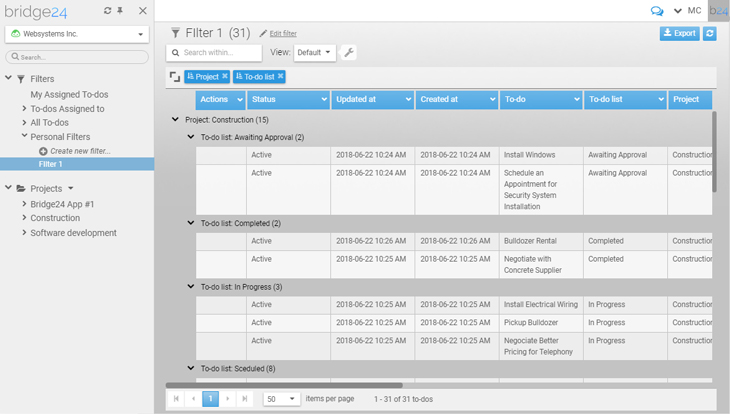


 Ever think to yourself that “there must be a better way to get the information I want out of my application?”. This month in Bridge24 we are releasing the ability to export your information from your connected
  Trello is a great operational tool for users to centrally collaborate on board and card information. However, reporting features are limited! With Bridge24, users can connect dynamically to Trello and instantly create and export powerful charts and card lists for basic reports.