Subtotals and Totals for Reports using Bridge24
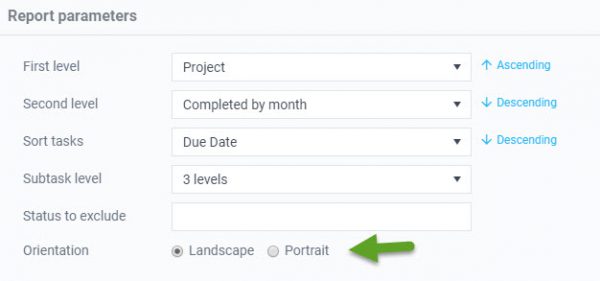
A report provides a structured and formated way to view your cards, tasks or to-dos. You can Group your report to easily segment the information into categories down to 2 levels. We have now released the possibility to tally up the information in your fields to each grouped level as well as other operations! Those needing reports using Custom fields in Trello or Asana across boards and projects should be happy with this latest enhancement.
Subtotals for reports
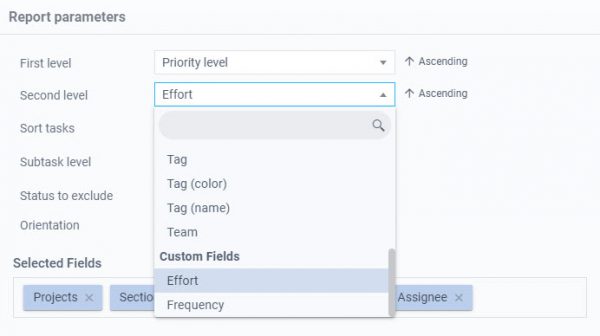
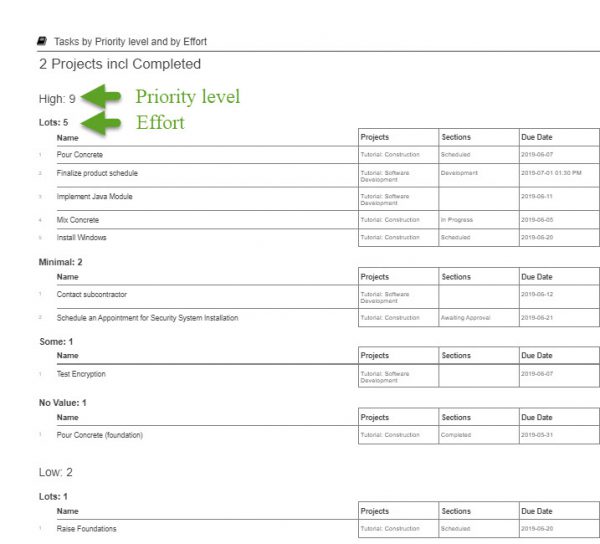
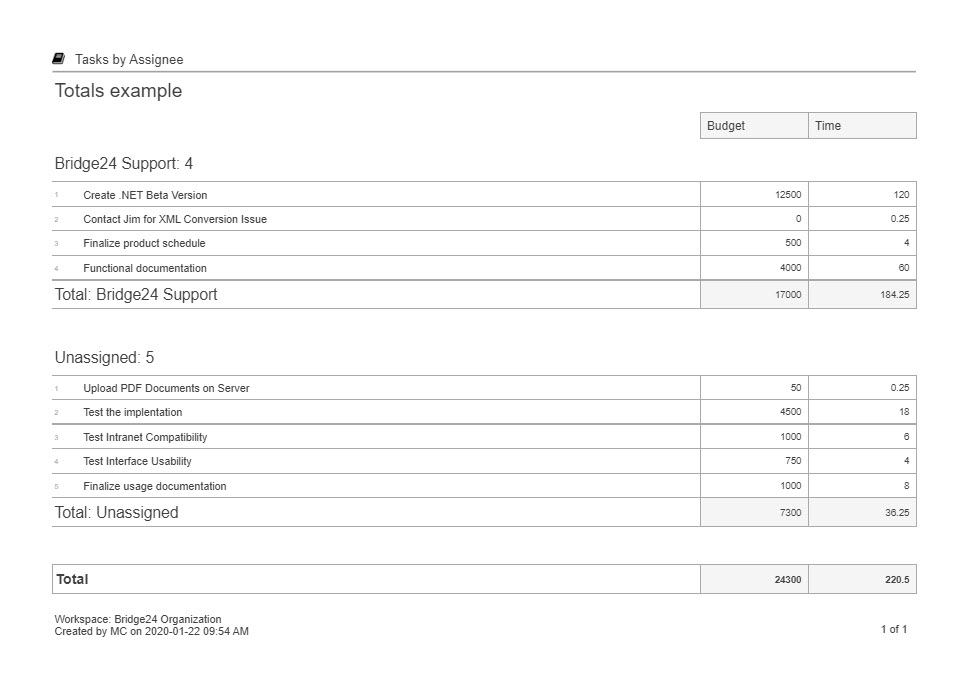
When a field is populated by numeric values, you can now add the ability to view summary information at the bottom, including the sum. This can be used, for example, in a field displaying expenses. The expenses can be summed for each group level, and as well, have a final total. In the example below, the report is grouped by Assignee, and 2 Custom fields from Asana called Budget and Time are added, with sums for each group, and a Total at the bottom.
 Project management is a continuously growing industry with more teams joining it and online collaboration tools being developed. In fact, according to the Project Management Institute, there were only more than a hundred of this software back in 2000. Today, more than a thousand are available options for project management teams. It is believed that one of the reasons for this is the temporary nature of projects. This means that every project is unique and each of them may require various tools. Another reason is user satisfaction wherein a user will keep using a tool for as long as it meets its needs. With this, it can be concluded that what project management teams need is a tool that can adapt to the different types of tasks and hold many features that are easy to use. These can be found in Bridge24.
 The use of cloud-based project management software has become increasingly popular, thanks to the convenience and ease-of-use that these tools provide. Many project management teams have taken advantage of the benefits that using these can bring. In fact, a good number of them vouch for the higher productivity that they have achieved ever since they started using these project management tools. The market today already brims with numerous software of this type and every company and team seems to be able to find one that suits their needs. And among the software that is being used is Asana.